
Source: NAAR Flexmls export pulled Sept 23, 2026 · 5,918 listings in MLS areas 100–499 · 4,664 closed sales since Jan 2019 · Prepared for Michelle Linton
Verdict: Transaction slowdown with buyer leverage. Values are stable, not falling.
No, values are not falling. Fewer homes are selling and buyers are getting more concessions and more negotiating room, but comparable homes are selling for about the same as a year ago. The pressure is concentrated in homes over $1.25 million and in SW City.
What the data shows: Closings fell 8.6% over the last 12 months (479 vs. 524). Available inventory is nearly flat (147 homes vs. 142 a year ago). The quality-adjusted value index has held within about ±3% since early 2024. Cancellations rose 36%, and 44% of the homes on the market today have had a price cut.
My read: This is a slower market, not a declining one. The early warnings to watch are the growing inventory above $1.25M, the rise in cancellations and relistings, and the larger concessions.
EXECUTIVE SUMMARY
The ten questions
“Current” means the trailing 12 months (Sept 2025 – Aug 2026) compared with the 12 months before, unless noted. Inventory is counted as of Sept 23 each year.
| Question | Answer | Evidence |
|---|---|---|
| Is single-family inventory building? | Barely | 147 available today vs. 142 a year ago (+4%), and still about 25% below summer 2019. It is building above $1.25M (42 vs. 21) and in SW City (45 vs. 35). |
| Is buyer demand declining? | Modestly | Closings −8.6% (479 vs. 524) and new contracts −4% (499 vs. 519) over 12 months. Jan–Aug closings −11%. Sales-to-new-listings fell to 72% from 82% this summer. |
| Are homes taking longer to sell? | No | Median DOM on closed sales is 62 days vs. 69. Summer was faster: 53 vs. 67. The exception is unsold stock: 62 active homes are past 90 days. |
| Are sellers cutting prices more often? | Slightly, on unsold homes | Closed sales with a price cut: 33% vs. 30% (T12). This summer it was lower (23% vs. 34%). But 44% of today’s active listings have been cut. |
| Are buyers gaining negotiating leverage? | Yes, at the margins | Sale-to-original-list is 97.9% vs. 98.5% (T12). Cancellations +36%. Last fall and winter the ratio dropped to 95.5–97%, the lowest since the 2022 reset. |
| Are seller concessions increasing? | Bigger, not more often | On 43% of sales vs. 42%, but the median rose from $7,930 to $10,000. NE City: 66% of sales have concessions. |
| Are comparable homes selling for less? | No | The quality-adjusted index is flat (±3%) for 10 quarters, and T12 median $/SF is −0.9%, within noise. Repeat-sale losses are rising (12% of 2026 resales), but from a low base. |
| Which price ranges are weakening first? | $1.25M+ and sub-$700K | Luxury: inventory doubled, $2M+ has about 10 months of supply. Sub-$700K: scarce inventory, but $/SF is down 2–7% and most sales carry concessions (an affordability limit). |
| Which areas are weakening first? | SW City, then NE City | SW: closings −18%, inventory +29%, cancellations +68%. NE: closings −19%, $/SF −1.9%, concessions on two-thirds of sales. |
| Which areas remain resilient? | NW City, $900K–$1.25M | NW is the only area with more closings (+6.5%). $900K–$1.25M: sales +6%, DOM 61 vs. 82, fewer price cuts. |
THE MOST IMPORTANT QUESTION
Are comparable homes selling for less?
A median price can move just because a different mix of homes sold. This index adjusts every closed sale for square footage, age, lot size, beds, baths, new construction and MLS region, so what is left is the change in value.
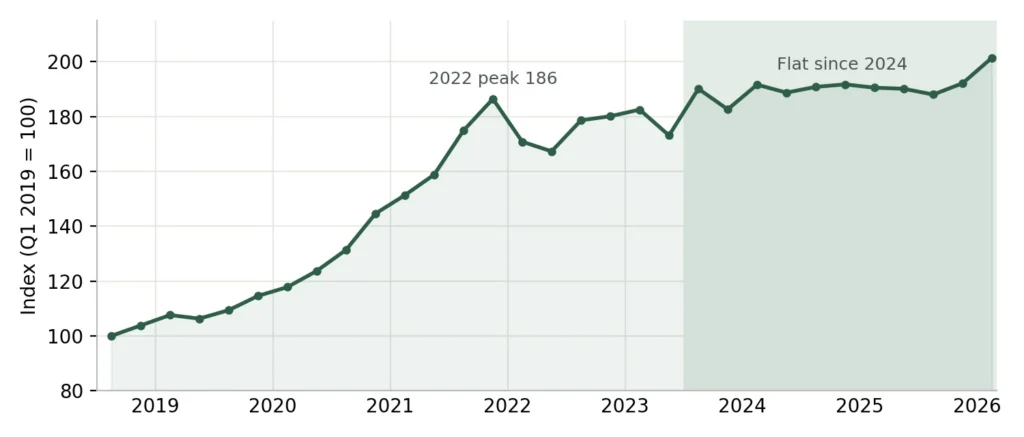
Values peaked in Q2 2022 (186), dipped about 10% into late 2022, recovered by 2024, and have held between 183 and 192 (mostly 188–192) for ten straight quarters. Q3 2026 (201) only covers July through Sept 23 and has fewer sales, so treat it as provisional. It does not show a decline. Hedonic regression on 4,658 closed sales; Q1 2019 = 100.

Repeat sales: same home, same square footage, resold at least 6 months later. The share of losses has tripled from a small base (99 pairs in 2024, 132 in 2025, 86 so far in 2026). Of homes bought in 2022 and resold in 2025–26, 20% sold below their purchase price (55 pairs). Median $/SF has been flat at roughly $385–$400 since spring 2024; summer 2026 ($400 for Jun–Aug) is 2.7% above summer 2025.
SUPPLY AND DEMAND
Inventory versus buyers
Inventory is back to about where it was a year ago, still well below 2019 levels. Buyer contracts are running slightly behind last year.

Active inventory is rebuilt from list, contract, cancel and expiration dates, and it matches today’s live count (reconstructed 187 vs. 189 in MLS). Homes under contract with a contingency (PBK/ACR, 40 today) count as pending, not available.
NEGOTIATING LEVERAGE
Where buyers are gaining ground
Concessions have been on 40–45% of sales for three years, about double 2021–22 levels, so how often they happen is not new. What is new is how big they are: the median concession rose to $10,000 (1.3% of price) from $7,930 (1.0%). In SE City it rose to $13,764 from $8,500. Rate buydowns are rare (6 in the last 3 months).
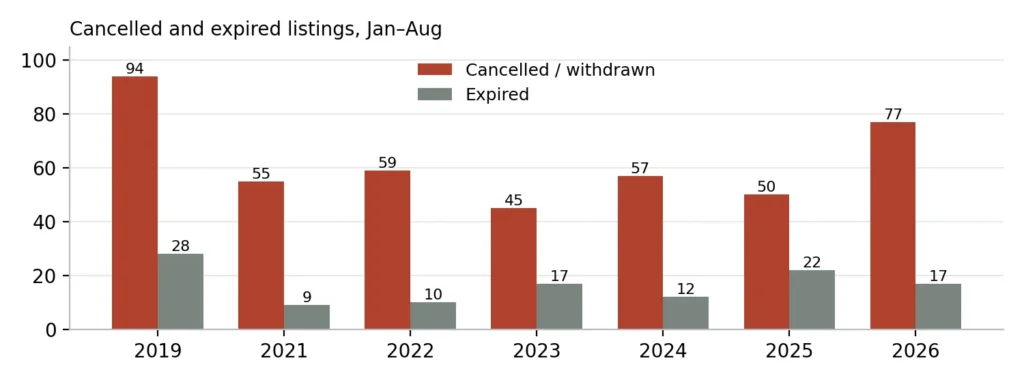
Cancellations are up 54% year over year for Jan–Aug (77 vs. 50) and are at their highest since 2019. Relistings (same parcel relisted within 180 days of a cancel or expiration) rose to 62, from 52 in 2025 and 39 in 2024. Sellers are pulling listings and repricing rather than accepting offers.
Homes on the market today: 149 available. 66 (44%) have already had a price cut, and 62 (42%) have been on the market 90+ days. Another 40 are under contract with a contingency. The median active list price is $910,000, above the $819,000 median sale price. That gap is the stale inventory this fall has to clear.
PRICE SEGMENTS
Where weakness is showing first
Trailing 12 months vs. prior 12 (prior in parentheses). Months of supply = Aug 31 inventory ÷ average monthly sales. Active today is as of Sept 23.
| Band | Sales | Med $/SF | Med DOM | Sale/orig list | % cut | % conc. | Mo. supply | Active today | Read |
|---|---|---|---|---|---|---|---|---|---|
| Under $500K | 33 (29) | $357 (−6.5%) | 56 (47) | 97.2% (96.7) | 33% (34) | 52% (38) | 2.9 (1.7) | 6 (6) | Tight supply · buyers want concessions |
| $500K–$700K | 124 (145) | $380 (−2.3%) | 62 (57) | 96.9% (98.3) | 44% (34) | 61% (55) | 2.5 (3.4) | 22 (37) | Scarce supply · most negotiated |
| $700K–$900K | 142 (168) | $387 (+2.1%) | 65.5 (69.5) | 98.3% (99.3) | 35% (28) | 42% (45) | 3.5 (3.5) | 44 (47) | Balanced · more cancellations |
| $900K–$1.25M | 113 (107) | $379 (−1.3%) | 61 (82) | 99.1% (98.8) | 22% (33) | 37% (36) | 3.8 (4.0) | 33 (31) | Healthiest band |
| $1.25M–$2M | 42 (48) | $458 (0.0%) | 48.5 (66.5) | 97.9% (98.2) | 24% (23) | 21% (25) | 5.7 (4.0) | 22 (9) | Inventory building |
| $2M+ | 25 (27) | $713 (−3.0%) | 119 (113) | 97.1% (93.8) | 32% (22) | 4% (15) | 10.1 (6.7) | 20 (12) | Oversupplied |
The market is splitting. Under $700K, inventory is scarce (28 homes today vs. 43), but buyers still negotiate hard: 44–61% of sales get concessions and $/SF is down 2–7%, which points to affordability limits rather than oversupply. From $900K to $1.25M is the healthiest band. Above $1.25M, inventory has more than doubled (42 homes today vs. 21), and $2M+ now has about 10 months of supply. Under $500K and $2M+ have fewer than 35 sales; read with caution.
GEOGRAPHY
MLS areas
Flagstaff Overall = NW City (100s), SW City (200s), SE City (300s) and NE City (400s).
NW City — Resilient
Only area with more closings (180 vs. 169). $/SF flat at $395. Inventory is up 15% (60 vs. 52) and cancellations doubled (45 vs. 21), so sellers are testing prices, but buyers are showing up.
SW City — Weakest
Closings −18% (116 vs. 141). Inventory +29% (45 vs. 35). Months of supply 4.3 vs. 3.7. Price cuts on 35% of sales vs. 30%. $/SF is still flat ($404), so this is a slowdown plus buyer leverage, not falling values.
SE City — Negotiating shift
Closings −12% (118 vs. 134), but inventory is down (28 vs. 33). DOM is faster (57 vs. 78). Concessions are larger: median $13,764 vs. $8,500, on 42% of sales vs. 34%. Price cuts are deeper (5.9% vs. 4.3%). $/SF is flat ($388).
NE City — Affordability strain
Closings −19% (65 vs. 80) on very thin inventory (14 homes). Median price −3.5% ($555K) and $/SF −1.9% ($357). Concessions on 66% of sales. Buyers at this price point need help with closing costs.
SEASONALITY CHECK
Same season, every year (Jan–Aug)
Flagstaff is seasonal, so this compares the same eight months each year. 2020 is left out because of pandemic distortions.
| Jan–Aug | Closed | Median price | Med $/SF | Med DOM | Sale/orig list | % cut | % conc. | Cancelled | Expired |
|---|---|---|---|---|---|---|---|---|---|
| 2019 | 431 | $435,000 | $220 | 62 | 98.7% | 23% | 33% | 94 | 28 |
| 2021 | 540 | $600,000 | $299.5 | 47 | 102.2% | 9% | 21% | 55 | 9 |
| 2022 | 415 | $740,000 | $366 | 43 | 100.4% | 15% | 20% | 59 | 10 |
| 2023 | 279 | $725,000 | $370.6 | 45 | 98.9% | 23% | 42% | 45 | 17 |
| 2024 | 333 | $737,054 | $392.4 | 59 | 98.5% | 26% | 40% | 57 | 12 |
| 2025 | 363 | $791,829 | $392 | 66 | 98.5% | 29% | 42% | 50 | 22 |
| 2026 | 322 | $817,500 | $388.9 | 56 | 98.6% | 28% | 45% | 77 | 17 |
MARKET TURNING DASHBOARD
Indicator by indicator
Current = trailing 12 months (Sept 2025 – Aug 2026) vs. the prior 12. Active inventory = Sept 23, 2026 vs. Sept 23, 2025.
Flagstaff Overall
| Indicator | Current | Prior year | % change | Trend | Interpretation |
|---|---|---|---|---|---|
| Active Inventory | 147 | 142 | +3.5% | ↑ | Roughly flat |
| Months of Supply | 3.8 | 3.7 | +2.7% | ↑ | Balanced to seller-leaning |
| New Listings | 653 | 672 | -2.8% | ↓ | Steady seller supply |
| Pending Sales | 499 | 519 | -3.9% | ↓ | Demand softer |
| Closed Sales | 479 | 524 | -8.6% | ↓ | Mild slowdown |
| Median DOM | 62 | 69 | -10.1% | ↓ | Selling faster |
| Median Sale Price | $819K | $795K | +3.0% | ↑ | Up (may reflect mix) |
| Median $/SF | $389 | $392 | -0.9% | → | Values flat |
| Sale / Original List % | 97.9% | 98.5% | -0.6% | → | Negotiating room steady |
| Price Reductions (% of sales) | 33% | 30% | +10.0% | ↑ | Steady |
| Seller Concessions (% of sales) | 43% | 42% | +2.4% | ↑ | Steady frequency |
| Median Concession $ | $10,000 | $7,930 | +26.1% | ↑ | Larger concessions (hidden discount) |
| Expired / Cancelled / Withdrawn | 162 | 131 | +23.7% | ↑ | More sellers giving up |
NW City
| Indicator | Current | Prior year | % change | Trend | Interpretation |
|---|---|---|---|---|---|
| Active Inventory | 60 | 52 | +15.4% | ↑ | Inventory building |
| Months of Supply | 4.1 | 4.0 | +2.5% | ↑ | Leaning balanced to buyer |
| New Listings | 248 | 224 | +10.7% | ↑ | More sellers listing |
| Pending Sales | 186 | 176 | +5.7% | ↑ | Demand firmer |
| Closed Sales | 180 | 169 | +6.5% | ↑ | Volume rising |
| Median DOM | 67 | 75 | -10.7% | ↓ | Selling faster |
| Median Sale Price | $798K | $765K | +4.3% | ↑ | Up (may reflect mix) |
| Median $/SF | $395 | $395 | +0.1% | → | Values flat |
| Sale / Original List % | 97.7% | 98.9% | -1.2% | → | Buyers gaining leverage |
| Price Reductions (% of sales) | 34% | 32% | +6.3% | ↑ | Steady |
| Seller Concessions (% of sales) | 39% | 43% | -9.3% | ↓ | Steady frequency |
| Median Concession $ | $7,500 | $7,000 | +7.1% | ↑ | Steady size |
| Expired / Cancelled / Withdrawn | 57 | 38 | +50.0% | ↑ | More sellers giving up |
SW City
| Indicator | Current | Prior year | % change | Trend | Interpretation |
|---|---|---|---|---|---|
| Active Inventory | 45 | 35 | +28.6% | ↑ | Inventory building |
| Months of Supply | 4.3 | 3.7 | +16.2% | ↑ | Leaning balanced to buyer |
| New Listings | 177 | 177 | 0.0% | → | Steady seller supply |
| Pending Sales | 126 | 135 | -6.7% | ↓ | Demand softer |
| Closed Sales | 116 | 141 | -17.7% | ↓ | Transaction slowdown |
| Median DOM | 63.5 | 74 | -14.2% | ↓ | Selling faster |
| Median Sale Price | $875K | $870K | +0.6% | → | Flat (check $/SF; mix moves medians) |
| Median $/SF | $405 | $404 | +0.0% | → | Values flat |
| Sale / Original List % | 97.7% | 98.3% | -0.6% | → | Negotiating room steady |
| Price Reductions (% of sales) | 35% | 30% | +16.7% | ↑ | More price cuts |
| Seller Concessions (% of sales) | 36% | 42% | -14.3% | ↓ | Concessions less common |
| Median Concession $ | $9,301 | $7,960 | +16.8% | ↑ | Larger concessions (hidden discount) |
| Expired / Cancelled / Withdrawn | 52 | 33 | +57.6% | ↑ | More sellers giving up |
SE City
| Indicator | Current | Prior year | % change | Trend | Interpretation |
|---|---|---|---|---|---|
| Active Inventory | 28 | 33 | -15.2% | ↓ | Inventory tightening |
| Months of Supply | 3.3 | 3.4 | -2.9% | ↓ | Balanced to seller-leaning |
| New Listings | 142 | 166 | -14.5% | ↓ | Fewer sellers listing |
| Pending Sales | 117 | 129 | -9.3% | ↓ | Demand softer |
| Closed Sales | 118 | 134 | -11.9% | ↓ | Transaction slowdown |
| Median DOM | 57 | 78 | -26.9% | ↓ | Selling faster |
| Median Sale Price | $948K | $918K | +3.2% | ↑ | Up (may reflect mix) |
| Median $/SF | $388 | $389 | -0.3% | → | Values flat |
| Sale / Original List % | 97.9% | 98.1% | -0.2% | → | Negotiating room steady |
| Price Reductions (% of sales) | 30% | 29% | +3.4% | ↑ | Steady |
| Seller Concessions (% of sales) | 42% | 34% | +23.5% | ↑ | Concessions more common |
| Median Concession $ | $13,764 | $8,500 | +61.9% | ↑ | Larger concessions (hidden discount) |
| Expired / Cancelled / Withdrawn | 31 | 37 | -16.2% | ↓ | Steady |
NE City
| Indicator | Current | Prior year | % change | Trend | Interpretation |
|---|---|---|---|---|---|
| Active Inventory | 14 | 22 | -36.4% | ↓ | Inventory tightening |
| Months of Supply | 3.1 | 3.4 | -8.8% | ↓ | Balanced to seller-leaning |
| New Listings | 86 | 105 | -18.1% | ↓ | Fewer sellers listing |
| Pending Sales | 70 | 79 | -11.4% | ↓ | Demand weakening |
| Closed Sales | 65 | 80 | -18.8% | ↓ | Transaction slowdown |
| Median DOM | 54 | 52 | +3.8% | ↑ | Pace steady |
| Median Sale Price | $555K | $575K | -3.5% | ↓ | Down (may reflect mix) |
| Median $/SF | $357 | $364 | -1.9% | → | Values flat |
| Sale / Original List % | 98.2% | 98.8% | -0.6% | → | Negotiating room steady |
| Price Reductions (% of sales) | 31% | 30% | +3.3% | ↑ | Steady |
| Seller Concessions (% of sales) | 66% | 56% | +17.9% | ↑ | Concessions more common |
| Median Concession $ | $10,200 | $7,500 | +36.0% | ↑ | Larger concessions (hidden discount) |
| Expired / Cancelled / Withdrawn | 22 | 23 | -4.3% | ↓ | Steady |
LEADING INDICATORS
The five strongest signals of change
- Inventory above $1.25M. 42 homes today vs. 21 a year ago. $2M+ has about 10 months of supply, and $1.25–2M about 6. This is the clearest sign of oversupply in the data.
- Cancellations and relistings. Cancellations are up 36% over 12 months and 54% for Jan–Aug. Sellers pulling listings usually comes before price cuts that finally stick.
- Concession size. The share of sales with concessions is steady, but the median concession is up about 26% ($7,930 → $10,000), and more in SE City. This is a quiet discount the headline price doesn’t show.
- Repeat-sale losses. Homes reselling below their prior sale price went 4% → 8% → 12% (2024 to 2026). It is small but rising, and concentrated among 2022 buyers.
- Stale active listings. 62 of 149 available homes have been on market 90+ days, and 44% have been cut. If fall contracts don’t clear them, sale-to-list ratios will slip.
30 / 60 / 90-DAY MARKET WATCH
What to watch next
Next 30 days
- New contracts in Sept–Oct vs. 2025 (Sept 1–23: 32 vs. 36)
- Whether the 62 homes at 90+ days get new cuts or cancel
- New listings above $1.25M, and any contracts there
Next 60 days
- Sale-to-original-list ratio on Oct–Nov closings. Last fall it fell to 96.7–97.2%. A reading below that would be new weakness.
- Median concession dollars, by area
- Fall cancellations and expirations vs. last year’s 12–20 a month
Next 90 days
- Q4 quality-adjusted index vs. Q4 2025 (190.1)
- Repeat-sale loss share for Q4 closings
- Months of supply by band as inventory falls into winter
Evidence that would signal real price declines
The quality-adjusted index falls more than 3% year over year for two quarters in a row. Repeat-sale losses pass 20%. Sale-to-original-list stays under 96% in the spring, when it normally rises. Inventory builds in the $700K–$1.25M core, not just in luxury. Concessions keep growing while $/SF also falls.
Evidence that the slowdown is seasonal and the market is stabilizing
Fall contracts match 2025. Winter sale-to-list stays at or above last winter’s 95.5–96.7%. Luxury inventory drops as listings expire and aren’t relisted. Concession dollars level off. The Q4 index stays within ±3% of 190.
METHOD NOTES
Facts vs. interpretation: Figures come directly from the Flexmls export. Text labeled “read,” “interpretation,” or shown as a verdict is analysis.
Method: Single-family residence sub-type only. Statuses: closed, active, pending (including PBK/ACR contingent), cancelled, withdrawn, expired and temp-off, Jan 1, 2019 – Sept 23, 2026. Price cut = final list price at least 0.5% below original list. Concession = Seller Concessions flag or a dollar amount in Repairs, Closing Cost or Rate Buy Down. Historical inventory is reconstructed from listing dates, so early-2019 counts are approximate. September 2026 is a partial month, so monthly charts end in August. The value index is a log-linear regression with quarterly time effects; small samples in any one quarter add noise.
Not an appraisal. Small-sample figures are flagged throughout.
About the Report
Michelle Linton
Associate Broker | Linton Real Estate
(928) 600-3974
[email protected]
304 S Elden Street
Flagstaff, AZ 86001


